Hello Leadville Race Series Family, We continue to be inspired and immensely grateful for the…
The Data Behind a Sub-9 LT100MTB Finish

What does it take to go Sub-9 at Leadville? Stages Cycling breaks down the data behind Marvin Sandoval’s 2019 Stages Cycling Leadville Trail 100 MTB effort where he finished in 8:32.
The Stages Cycling Leadville 100 MTB Race is Iconic. It’s equally as well known for the caliber of athletes that attend the event as it is for its pure brutality. The entire race takes place above 9,200 feet elevation and only goes up from there; to above timberline at the halfway point at the Columbine Mine. The total elevation gain for the event is about 12,000 feet in total! In 2019, 1,644 racers registered for the start with 1,401 athletes officially finishing, though some of them were outside the 12 hour final cut off to receive the silver buckle. That’s right, for all the punishment and hard work, finishers are awarded a belt buckle. The finisher buckle is the prize for finishing in 12 hours or less and for the aerobic animals that finish in less than 9 hours, the coveted, and larger, silver and gold buckle awaits. In 2019, 324 finishers earned the big buckle.
Local Leadville hero Marvin Sandoval has been kind enough to share his power data from the 2019 event. Marvin was 41 at the time of the 2019 event. When it comes to the Leadville MTB 100, Marvin is a hearty veteran. The 2019 running of the mtb event was Marvin’s 10th. And he has 10 of the 9 hour finisher buckles to prove it! Marvin’s best Leadville finishing time is 8:08 and in his rookie attempt, he clocked his slowest time at 8:57, squeaking in with 3 minutes to spare to earn his first “big buckle”. Not only has Marvin gathered all of these buckles at the LT100 MTB, he is also a successful Leadman finisher, which means he’s participated in all the Leadville Race Series events in a single season, even running the Leadville 10k the day after the LT100MTB! For more on Marvin, check out www.leadfeetendurance.com
2019 Leadville MTB 100 Effort
Using Stages Link, we can do a bit of file analysis and get a sense of what the event truly demands. Being a native to Leadville, Marvin has some advantages. His relative performance in the race is not going to be hindered by the altitude as he is fully acclimated. Further, he has an intimate knowledge of the course as it’s just out his back door. He can ride open sections “at his leisure” throughout the year.
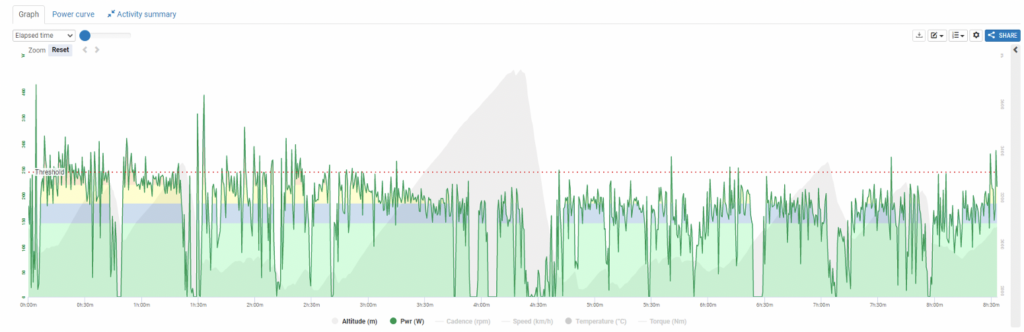
Above is a screenshot of the entire race as recorded by Marvin. In green, in the foreground, is the power that was recorded every second. In the background, in grey, is the course profile as recorded by his GPS-enabled head unit. The horizontal red line is his estimated threshold power of 240w, and the color scale from green, to blue, to yellow, to orange, to red and finally into purple, shows what zone his power was in at any particular point of the race (more on that later).
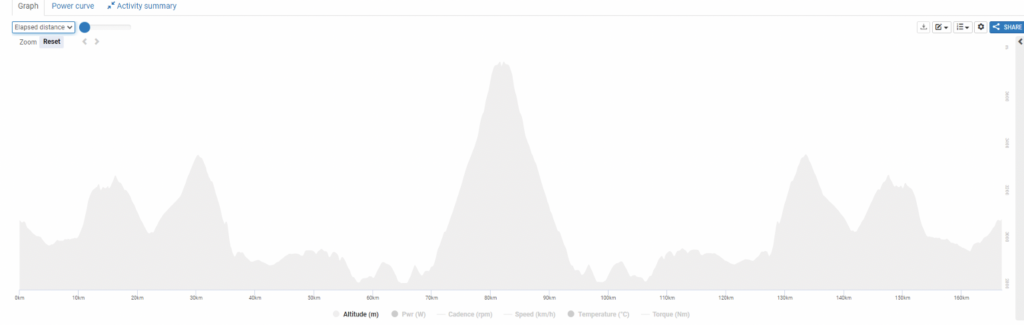
Note that in the first screenshot above, the x axis is time, not distance. This means the Columbine climb/descent in the middle of the file appears to have a descent off the edge of a cliff. For better perspective of the profile as recorded by Marvin, I have reposted the file here with distance as the X axis, just for the sake of demonstration of the actual course profile (according to distance, not time) with elevation as the only metric displayed.
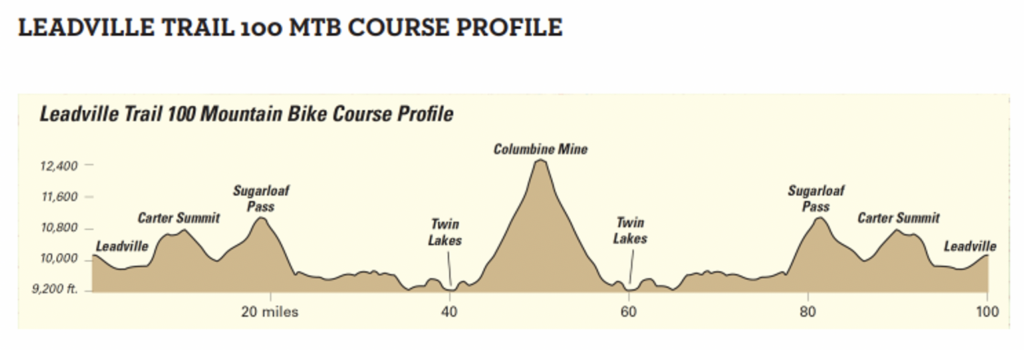
And below is the course profile taken from the 2017 Leadville Race Series Athlete Guide. This graphic highlights many of the important features of the course. This makes it very clear that the course is an out-and-back, with Columbine Mine as the halfway point.
As a coach, when evaluating a performance like this, I typically, first, divide the ride into halves, then quarters, then into the important segments. A characteristic of a well-paced race is the even distribution of work throughout the entire duration of the event. Of course, there are lots of factors that will influence whether a race has what we call “even splits” meaning, each segment or interval we are using for comparison has a similar average power. For example, on a course that has a ton of climbing at the beginning, you might expect there to be more energy spent early in the race. In this particular case, the first half of the race has about 50% more climbing (concentrated on the push up Columbine) so the expectation would be that power is quite a bit higher in the first half than the second half. Finally, this is a mass start race, and not a time trial. Meaning, there are times when competitors are grouped together and enjoying the benefits of drafting and riding in a peloton. The speed/power relationship are influenced by those times when a competitor is enjoying the benefit of riding in the bunch. For many Leadville competitors “staying in a bigger group through the descent off of the Carter Summit” is a typical pre-race strategy. However, looking at a file in smaller parts can give us some cursory insight into how well the ride was paced.
The rider by the numbers:
Age: 41
Weight: 145 lbs (66kg)
Threshold Power: 240 watts (at elevation)
The race by the numbers:
Duration: 8h32m
Distance: 103 miles (166.9km)
Elevation Gain: 10,928 feet as measured on his recording device (12,600 feet according to race guide)
Average power: 158w
Peak power: 768w
Adjusted power: 191w
Average cadence: 67 rpm (including 0’s or non pedaling events with speed recorded)
Average speed: 11.93 mph (19.2kph)
| First Half: | Second Half: | |||||
| Duration | 4h22m | Duration | 4h6m | |||
| Distance | 51.5 miles (83.5km) | Distance | 51.5 miles (83.5km) | |||
| Elevation Gain | 6525 feet (1989m) | Elevation Gain | 4189 feet (1277m) | |||
| Average Power | 177w | Average Power | 138w | |||
| Adjusted Power | 209w | Adjusted Power | 164w | |||
| Average Cadence | 68 rpm | Average Cadence | 66 rpm | |||
| Average Speed | 11.6 mph (18.6 kph) | Average Speed | 12.3 mph (19.8 kph) | |||
Conclusions:
- The second half of the race was faster than the first half.
- The second half of the race required less power (to go faster) than the first.
- The average cadence was lower in the second half of the race, than the first.
- These three points are because of the course that trends upwards for the first half (climbing is slower than descending).
Now, we need to drill down a bit deeper to see how the “pedal portions” were paced. By “pedal portions” I mean, the parts of the course that required (hard) pedaling, I.e., the climbing sections. We can dissect each individual climb and compare average power for each section. However, for our purposes, let’s pick Sugarloaf going out and coming back. As we can see from the profile, the Sugarloaf climb in the first half of the race is a bit shallower than the backside of the climb which averages 7.5% on the return leg. Further, there is a good chance that Marvin had more riders as company on the first climb up Sugarloaf as the earlier you are in the race, the more likely it is that others are going the same speed.
| Sugarloaf out: | Sugarloaf return: | |||||
| Duration | 32m | Duration | 46m | |||
| Distance | 5.2 miles (8.4km) | Distance | 3.7 miles (5.9km) | |||
| Elevation Gain | 1105 feet (337m) | Elevation Gain | 1450 feet (442m) | |||
| Average Power | 227w | Average Power | 149w | |||
| Adjusted Power | 231 | Adjusted Power | 170 | |||
| Average Cadence | 78 | Average Cadence | 67 | |||
| Average Speed | 15.7 kph (9.8 mph) | Average Speed | 7.3 kph (4.5 mph) | |||
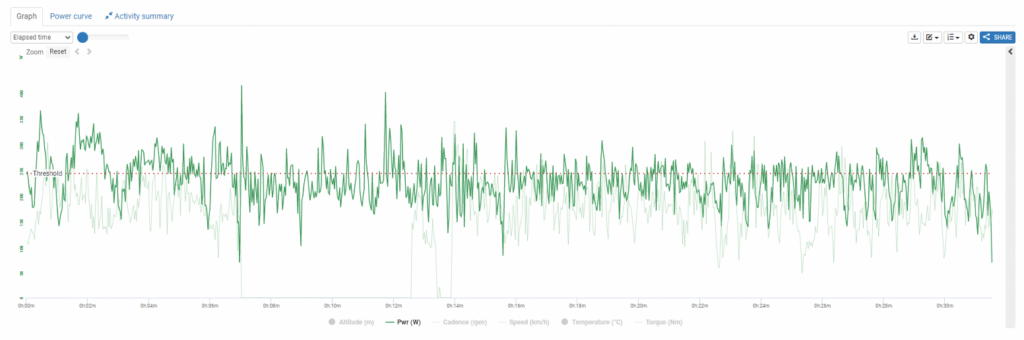
With Stages Link, we can even overlay the two segments to demonstrate the different power outputs on the two climbs. What you are seeing below is the power from the two segments overlayed on top of each other. The dark green is the first climb up Sugarloaf and the light green is the return climb up the backside of Sugarloaf. This easily demonstrates that Marvin was able to produce more power on the first ascent relative to the second ascent. If I were Marvin’s coach, I would inquire as to how much time he had to spend (if any) pushing his bike up the second climb. The low cadence and low speed give me a bit of concern and I might recommend his considering a lower gear for his mountain bike in an attempt to bring his cadence up.
None of this is a big surprise but it might lead to some questions/insights about nutrition management during the race. It would be easy, particularly in the excitement of riding in a group in the first act of the race, to neglect eating and drinking. Both are mistakes that could come back to haunt anyone in the second half of the race. For example, in the first half of the race, Marvin averaged 637 kJ/hour. This means that the energy he produced through mechanical work as measured by his power meter was about 2700 kJ for the first half of the race which equates to about 2700 Calories of energy that was required to fuel for that energy expenditure. In the second half of the race, Marvin averaged 496 kJ/hour or another 2000 kJ for the 2nd half of the race. In total, Marvin did approximately 4700 kJ of work which requires about the same amount of Caloric feed. With the excitement of the race, all of the climbing in the first half, racing in a tight bunch, and being at altitude, one can see how it might be difficult to stay in front of your Caloric need by eating “early and often”. In a race like this, it’s best to think of eating as an investment for later in the event. If you’re ever hungry in a race like this, unless it’s in the last 10-15 minutes, you’re definitely behind the Caloric burn/intake equation.
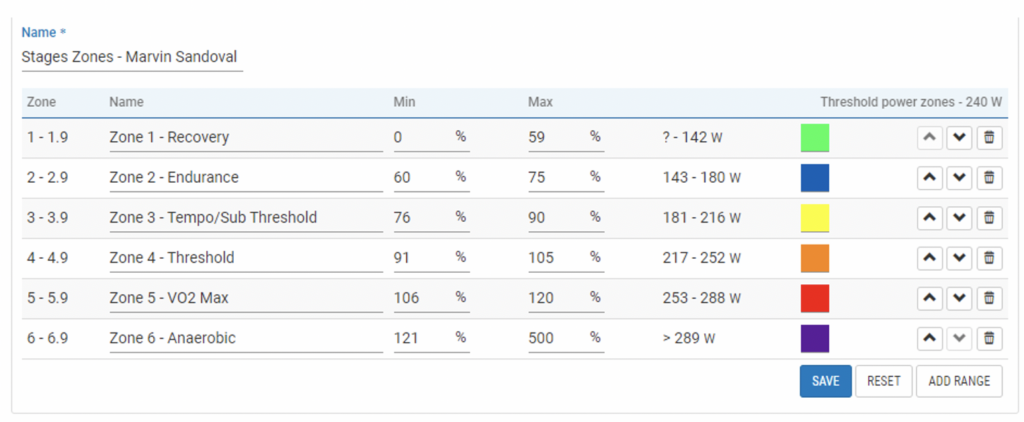
Finally, let’s take a look at the overall pacing strategy, from the standpoint of how much time Marvin spent in his different training zones. Stages Link sets up zones according to default settings that are edit-able depending on what your personal preferences are as noted below. These zones are created based on an input Threshold Power value, in this case, 240 watts.
For a long event like this one, I would expect and hope there is very little time spent at or above threshold. Remember, when you are above your threshold, you are on “borrowed time”. The body can only support so much time at higher intensities as power is anchored in time. The higher the intensity, the less time you can spend at that level. Conversely, the longer the timespan, the lower the maximum intensity can be sustained.
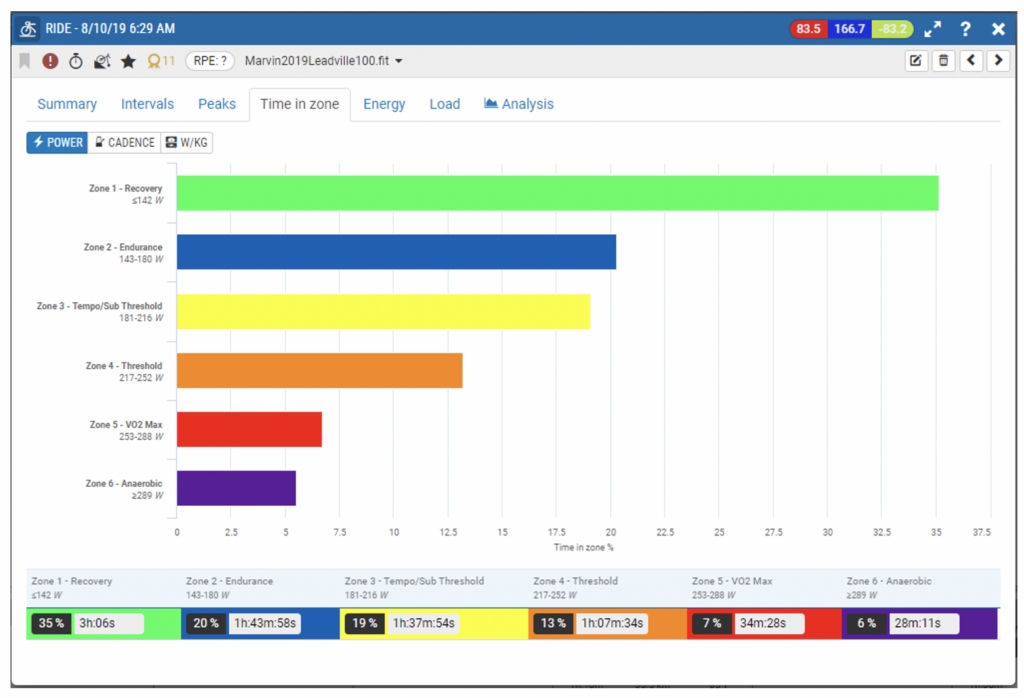
To my eyes, it looks like Marvin did a great job “governing” his race. In an event lasting 8.5 hours, he spent 13% of the race ABOVE his threshold zone and only 13% of the race IN his threshold zone. It’s inevitable in a hilly/mountainous event like this that the course and terrain demand require high power outputs for short periods of time. It would be easy to get “sucked into” riding outside of a sustainable power for extended periods of time. Again, the emotional excitement of the race, the competitive desire to stay with faster competitors and the climbing nature of the course can all be pitfalls that could derail the possibility of having your best possible result. It looks like Marvin has been able to successfully apply what he has learned in his 10 years of competing in the Leadville MTB 100 to have an excellent, well-paced, well-managed race that assured him of yet another big buckle.