Hello Leadville Race Family! The smoke is lifting and the hundreds of personnel on the…
Leadville Tech Week: Power Analysis of Alex Wild’s Top-10 LT100 MTB Performance
Have you ever wondered what kind of power it takes to achieve a top 10 result at the Stages Cycling Leadville Trail 100 MTB? Find out below, as our friends at Stages Cycling break down Alex Wild’s power file from the 2021 LT100 MTB, where he finished 10th on the day.
In a previous article, I broke down what was required to earn the “big buckle” at the Stages Cycling Leadville Trail 100 MTB Race. Local Leadville Legend, and 11-time sub-9-hour-finisher Marvin Sandoval shared some insight and his data to highlight the demands of a “big buckle” worthy performance. This go ‘round we have the opportunity to look at the data from a top-10 finisher.
San Jose professional mountain bike racer, Alex Wild was kind enough to share his race data with us. Alex finished 10th in 2021’s edition. This was his second attempt at the MTB 100. In 2018, Alex finished 9th. He did note that his time was 15 minutes faster in 2021 than in 2018 but that his lower placing suggests a deeper and higher quality field.
So, with the help of Stages Link, let’s dive into the metrics Alex recorded with his power meter and head unit.
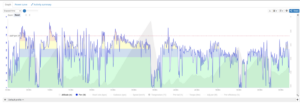
The screenshot above represents some of the data that was collected by Alex. The bold blue line is the power that was recorded every second. The grey saw tooth pattern in the background is the elevation profile of the course as recorded by his head unit. The dashed red line indicates where Alex estimates his threshold power to be when at 10,000 feet of elevation. At sea level he estimates his threshold power to be approximately 405 watts, and has calculated that the penalty to his threshold, while competing at altitude is approximately 65 watts. So, his “altitude threshold power” is about 340w. The colors (green, blue, yellow, orange, red, and purple) correspond to his training zones. When you see the solid green line go into his threshold zone, for example, you will see some orange in the foreground. So, not only are we able to see changes in intensity with his power recorded in one second intervals but also how intense the output is relative to his altitude-adjusted threshold power.
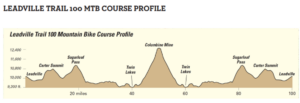
Keep in mind that the elevation profile above uses time as the X-axis. Because of this, the Columbine Mine descent, in the middle of the profile, appears to be vertical drop off. For a slightly better perspective, I have included a course profile from the Stages Cycling Leadville Trail 100 MTB Race technical guide. On this course profile, the X-axis represents distance (vs. time like above). With the Columbine Mine peak as the center point, it’s apparent this is an out-and-back event.
As discussed in the aforementioned article that highlights Martin’s sub-9 hour races, when I am trying to evaluate a performance like this, where pacing plays a critical part to success, I will often break the event down into more manageable chunks. To be able to determine how much of a drop off of performance there was throughout the event (if any at all), I will break the data into halves, then maybe quarters, then pull out the critical segments. With all the climbing on this course, the named hills play a big part in determining success or failure in this event. Since the largest climb of the day, the Columbine Mine climb, is considered to be a part of the first half of the course, it would make sense for there to be more energy spent (power produced) in the 1st half relative to the 2nd half. As previously noted, there is about 50% more climbing (elevation gain) in the 1st half of the course relative to the 2nd half. Also worth considering is that this is a mass start race. Although some riders will spend a lot of time riding solo, a la a time trial type effort, the best performing riders tend to be in a group on the flatter sections of the course. Being able to share the workload of the peloton, and benefitting from drafting other riders as they do their work increases the speed of riders that are traveling along in a group. For many Leadville participants, trying to stay in a bunch for the first 25 miles of the race can really set them up for success.
The rider by the numbers:
Age: 29
Weight: 148 lbs (67kg)
Threshold Power: 340 watts (at elevation), 405 watts at sea level
The race by the numbers:
Duration: 6h41m (official race time)
Distance: 105 miles (168.8km)
Elevation Gain: 10,856 feet as measured on his recording device (12,600 feet according to race guide)
Average power: 224w
Peak power: 940w
Adjusted power: 262w
Average cadence: 75 rpm (including 0’s or non-pedaling events with speed recorded)
Average speed: 14.95 mph (25.2kph)
| First Half: | Second Half: | |||||
| Duration | 3h25m | Duration | 3h15m | |||
| Distance | 52 miles (84.1km) | Distance | 52 miles (84.1km) | |||
| Elevation Gain | 6565 feet (2001m) | Elevation Gain | 4242 feet (1293m) | |||
| Average Power | 250w | Average Power | 198w | |||
| Adjusted Power | 287w | Adjusted Power | 229w | |||
| Average Cadence | 78 rpm | Average Cadence | 71 rpm | |||
| Average Speed | 14.7 mph (23.6 kph) | Average Speed | 15.5 mph (25.0 kph) | |||
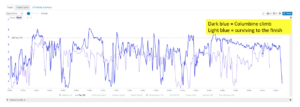
It’s one thing to see the summaries of the differences between the two halves (by distance) of the race. In Stages Link, we are able to overlay the data of the two halves and in doing so, can see the difference between the power output of the two different segments. The dark blue line represents the power as recorded every 1s for the FIRST HALF of the ride. The thinner blue line is the power as recorded every 1s for the SECOND HALF of the ride. What I notice straight away is that on the Columbine climb, noted below, Alex faded quite a bit. His post event notes confirm that he wasn’t able to stay with the leaders, “The climb up Columbine didn’t go as planned and I let too much space open up to the riders in front of me (Payson McElveen and Russell Finsterwald) which left me riding on my own from the top to the finish. This moment proved decisive for Alex’s overall result as Payson and Russell who finished 4th and 6th respectively, crossed the line more than 15 minutes ahead of Alex. Alex acknowledges this, saying, “The crux of this ride was Columbine, I needed to put out a little more effort there to stay with Payson and Finsty so I wouldn’t be on my own for the ride back.”. Note that in the graph below, I have eliminated some of the “noise” in the file by smoothing the power channel out to 60 seconds to better demonstrate trends in power production.
We are able to draw the same conclusions from Alex’s ride that we were able to draw from Marvin’s ride in the previous article. Those conclusions are:
- The second half of the race was faster than the first half.
- The second half of the race required less power (to go faster) than the first.
- The average cadence was lower in the second half of the race, than the first (even though there was less climbing).
- These three points are because of the course that trends upwards for the first half (climbing is slower than descending).
Let’s take a moment to compare Alex’s two ascents up Sugarloaf Pass. Alex first attacked this climb when he was relatively fresh, about 45 minutes into the race. On his return trip, he began the Sugarloaf Pass ascent just under 5 hours from when he took the start in Leadville. The elevation profile makes it apparent that on the way “out” the Sugarloaf Pass climb is shorter and shallower than the backside of the climb which averages 7.5% on the return.
| Sugarloaf out: | Sugarloaf return: | |||||
| Duration | 25m | Duration | 35m | |||
| Distance | 5.2 miles (8.4km) | Distance | 3.7 miles (5.9km) | |||
| Average Power | 309w | Average Power | 224w | |||
| Average Gradient | 4% | Average Gradient | 7.4% | |||
| Average Cadence | 88 | Average Cadence | 71 | |||
| Average Speed | 19.2 kph (11.9 mph) | Average Speed | 8.9 kph (5.5 mph) | |||
We noted the same sort of pattern with Marvin’s data from Leadville in 2019. I even speculated that if I were Marvin’s coach, I would inquire about the gearing selection/options on his mountain bike. Note the big difference in average cadence for each of the two ascents up Sugarloaf Pass. Obviously, the steep grade slows riders down significantly but pedaling at ~70 rpm for 35 minutes can be very fatiguing. I’m guessing that Alex was grunting the climb out in his easiest gear.
Alex noted that his nutrition strategy for this race included trying to consume upwards of 100g of Carbohydrate per hour during the race. However, his misstep on Columbine comes back to haunt him again. Alex notes he, “bonked pretty hard about 4 hours in from digging too deep chasing on my own off Columbine”. The extra energy he had to spend, presumably moving at a slower speed than his competitors riding in groups, cost him preceding and during his ascent of Sugarloaf Pass. The fact that Alex became glycogen depleted during a 6.5 hour race is not much of a surprise. In looking at his file summary in Stages Link, we see that he did approximately 5400 kJ of mechanical work measured at his power meter which equates to requiring roughtly 5400 Calories to fuel. Elite athletes can store approximately 2000 Calories of fuel in their skeletal muscle and liver. This means, at a minimum, Alex would need to take on about 3400 Calories to maintain a homeostatic condition. If we note that 1g of Carbohydrate yields 4 Calories and that Alex’s plan was to consume 100g (400 Calories) per hour, in a 6.5 hour race, he will have consumed about 2600 Calories. It’s pretty safe to assume that Alex was eating more than straight carbohydrate and that whatever he was eating would have some caloric contribution through protein and fats but, their contribution to short-term energy production are limited at best. So, my recommendation to Alex would be to continue to train the gut to process fuel. The math above reveals that he had very little margin of error in his fueling strategy and any mistake would manifest itself in a potential for reduced performance. To be clear, I’m not trying to be overly critical here. Managing race excitement, technical challenges on the mountain bike, Gastro Intestinal distress, and race intensity at altitude can certainly make staying on top of one’s nutrition very, very difficult. This fact highlights how important it is to have an executable nutrition strategy that can be practiced in race-like conditions well in advance of your race.
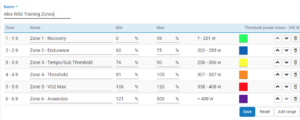
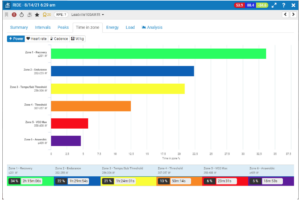
I found another not-unexpected-but-interesting-just-the-same similarity between Marvin and Alex’s performances. To dig into that nugget, we will need to establish what Alex’s training zones are. Stages Link sets up zones according to editable default settings. Below are the zones based on Alex’s threshold power of 340w.
 Next, we can see how much time Alex spent in each of his training zones during the race. That screenshot is below.
For a race of this duration, the expectation would be that racers would strive to spend limited time at or above their threshold power. Remember, one of the ways we define Functional Threshold Power (FTP) is the amount of work one can perform for an extended period of time, approximately one hour. Power is anchored in time meaning, the shorter the duration, the more maximal workload one can maintain and the longer the duration, the less maximal workload one can maintain. This means that any time that is spent above threshold is considered “borrowed time” or is akin to “running in the red”. High power work comes at a huge metabolic (caloric) cost making recovery very difficult. The limited access to oxygen at altitude amplifies this inability to recover as well.
One thing of note is that there must be a basic physical demand to this particular event. When comparing the time in zones for an elite athlete like Alex with the time in zone for local hero, Marvin Sandoval, a strong correlation emerges. Even though Marvin’s threshold power is estimated to be 100w lower than Alex’s, their “time in zone thumbprints” are strikingly similar. As a refresher, I have copy and paste the screenshot of Marvin’s power performance here:
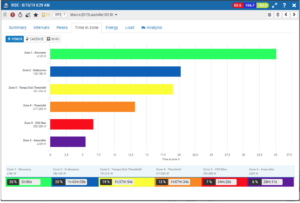
The summaries at the bottom of each bar graph give some great insight into “what it takes” to have a successful Stages Cycling Leadville 100 MTB Race. The differences between the times spent in each zone are within 2% for both riders. And each athlete spent 25% – 26% of the race time at or above their threshold. Three-time Tour de France overall winner, Greg Lemond famously has a quotation about racing that applies here. With respect to being a professional and developing elite physiology, he says, “It never gets easier, you just get faster”. While Alex and Marvin have unique physiologies, how these Leadville races probably “felt” for each athlete was probably very similar. While Alex has more power at his disposal by virtue of a massive FTP advantage relative to Marvin’s FTP, that doesn’t make him super man. He is still bound by the same limitations respective to the amount of time he can ride at high intensity. As a casual observer of the sport, it would be easy to assume that elite athletes can just “go harder”. The truth is, as Mr. Lemond suggests, Marvin and Alex were both “going hard”, Alex just happened to be going faster.
For those keeping score at home, Marvin successfully earned his 11th big buckle in 2021, finishing the event in personal record time of 7:52 and 58th place. Alex is eager to take another crack at the title in 2022.
We’d like to extend a special thank you to Alex Wild and Stages Cycling for their contributions to this article. To find out more about Stages Cycling and their products, check out www.stagescycling.com. To follow Alex Wild and his racing, check him out on Instagram or Strava.
DIG DEEP!